Why are Boolean Operations so slooo...ooow ? Part 1
Open CASCADE Boolean Operations (BOPs) have frequently been claimed to be slow. Have anyone tried to find out why ?
As you probably remember, I recently mentioned in another post that at Intel we have decided to integrate Open CASCADE into our application testing database. So I took on a challenge to create a few test cases to regularly check Intel Parallel Amplifier and Inspector (part of new Intel Parallel Studio).
In addition to my recent test cases with IGES import which has been prototyped to run in multi-threading mode, this time I have proceeded to Boolean Operations (BRepAlgoAPI). I requested a few models on the forum but replies were surprisingly not numerous :-(. Anyway, I am thankful to Evgeny L, Prasad G, Pawel K, as well as to Igor F for their examples.
The bottom line. On relatively complex models, overall achieved speed up was from 4x (100+ faces in a model) to 20x (several dozens faces). Examples of reduced CPU time – from 80secs to 20s, from 30s to 1.4s. (Disclaimer: once this article has been drafted during last week-end, I experimented with another set of models sent by Pawel Kowalski. They revealed other different bottlenecks than mentioned below, and therefore described improvements do not affect them. I’ll be continuing my experiments as time permits and will hopefully post further findings)
* Story *
So let us follow the steps which have been made.
I have focused on the BopTools_DSFiller class which is central to the Boolean Operations (BOP) as it prepares the models by intersecting them so that later on fuse, common, and cut just take its results and reconstruct requested combination.
As a first test case, I took two models provided by my former colleagues at OCC who participated in Intel Parallel Studio beta program. These were two solids of 130+ faces each, and BopTools_DSFiller::Perform()took 67secs of CPU time.
I installed the latest build of Intel Parallel Amplifier (reminder: public Beta will be available in early January and you can subscribe already now here – www.intel.com/go/parallel). The only applicable analysis type was ‘Hotspot Analysis’ which identifies most CPU-consuming functions. Amplifier also offers ‘Concurrency Analysis’ and ‘Waits & Locks Analysis’ but these were irrelevant as BOPs currently run in single thread only, while they are tailored to multi-threaded apps.
* First findings *
Top functions that Amplifier reported were located in TKGeomAlgo.dll and related to the IntPolyh package. Not surprising as BOPs are based on meshes intersection and IntPolyh creates those meshes.
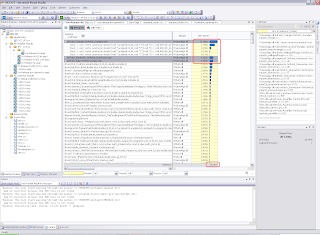
Top 3 functions – constructors of IntPolyh_Triangle, _StartPoint, and _Edge altogether took almost 20 seconds (see the image below).
(to be continued)

0 comments